


SEJournal Online is the digital news magazine of the Society of Environmental Journalists. Learn more about SEJournal Online, including submission, subscription and advertising information.
June 5, 2024
 |
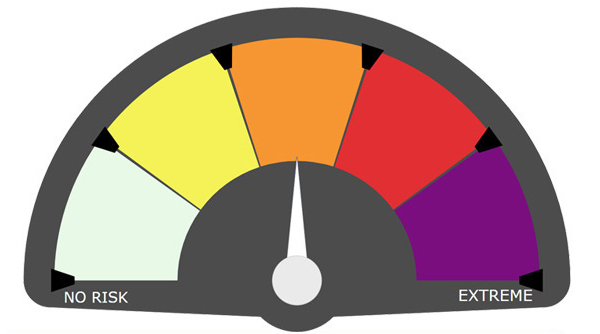 |
| A new heat-warning tool from the federal government includes a gauge with a new magenta risk level for dangerous, long-duration extreme heat events. Image: Centers for Disease Control and Prevention. |
Reporter’s Toolbox: New HeatRisk Data Site Helps Warn on Health Threats
By Joseph A. Davis
Heat kills. On an annual average, it takes the lives of more Americans than hurricanes and floods. And global warming is making it deadlier year by year. In 2023, heat-related illness led to almost 120,000 emergency room visits.
So, a newly enhanced federal data tool will help environmental journalists advise their vulnerable communities when extreme heat events present a risk to human health.
The HeatRisk mapping site was announced in April by the National Weather Service and the Centers for Disease Control and Prevention.
We already have heat-warning tools,
but this one is better. If news media
take it seriously, it could save lives.
We already have heat-warning tools, but this one is better. If news media take it seriously, it could save lives.
It’s an improvement for several reasons. It combines meteorological factors with medical factors to come up with a patient-centered view of heat risk. It also offers a seven-day forecast. And it adds a new risk level (magenta) to show “rare and/or long-duration extreme heat with little to no overnight relief.”
Where the data comes from
Even the private weather services ultimately get their data from the National Weather Service’s vast network of local weather instrument stations. NWS is part of the National Oceanic and Atmospheric Administration, which has even more recorded measurements and stored data in places like the National Centers for Environmental Information.
NWS temperature and humidity data is about as solid as any you can find. Their predictions aren’t so bad either. We all know (or should) that predictions lose reliability the further ahead you look. But meteorologists are getting more skilled in their predictions all the time.
You’ve already heard: ‘It’s not the heat,
it’s the humidity.’ … Actually, the
National Weather Service says,
it’s the heat and the humidity.
You’ve already heard: “It’s not the heat, it’s the humidity.” That’s because higher humidity makes it harder for sweat to evaporate from the skin — which is what cools us on hot days. Temperature and humidity are combined to make the “heat index,” which has already been invented and publicized by the NWS. Actually, the NWS says, it’s the heat and the humidity.
The HeatRisk indicators go beyond this to include things like the duration of heat waves and the likelihood of relief overnight.
Also, the data is more granular, offering high-resolution ratings to people who punch in their ZIP codes. That helps people visualize and heed factors like urban heat islands — which are hotter and often home to disadvantaged and vulnerable people.
How to use the data smartly
This data is not really meant for number-crunching in the way that data journalists often do. It is meant to warn people — emphasizing danger by presenting it with color codes rather than numbers.
So the best use of the data is to warn people. If you think about it, the weather is the one story that is always on the front page; at least it was during the days of legacy daily print newspapers. They had those little “ears” above the banner. But in this era of climate heating, extreme heat is often a longer story, sometimes national or international.
Another smart thing is to put the HeatRisk data in a larger context. Obviously, global heating is one context. The HeatRisk ratings can help expand people’s understanding of how global heating can hurt them or those they love.
Having the CDC involved (not just the NWS) makes it easier to bring in the health aspects of heat waves, such as how pregnant women may suffer. The site helps identify risks to vulnerable demographics — from the older person living alone in a house where the AC hasn’t worked for years to the farmworkers living in shacks at the edge of town with no AC at all.
Journalists can find more information about heat risk at sites like Heat.gov, which brings in information from many other agencies under the National Integrated Heat Health Information System.
[Editor's Note: For more on heat waves and health, see TipSheets on extreme temperatures as a local story, on urban heat islands and on heat-induced grid failures, and Toolboxes on resources for tying temperature shifts to climate change, for finding record temps and for tracking data on heat deaths. Also see our Backgrounder on extreme heat and human health, an EJ InSight on photographing extreme heat waves and a feature on reporting on workers in a warming world. For more on climate change generally, be sure to visit our Climate Change Resource Guide and its collection of resources on human health. Keep track of the latest heat wave-related headlines via EJToday.]
Joseph A. Davis is a freelance writer/editor in Washington, D.C. who has been writing about the environment since 1976. He writes SEJournal Online's TipSheet, Reporter's Toolbox and Issue Backgrounder, and curates SEJ's weekday news headlines service EJToday and @EJTodayNews. Davis also directs SEJ's Freedom of Information Project and writes the WatchDog opinion column.
* From the weekly news magazine SEJournal Online, Vol. 9, No. 23. Content from each new issue of SEJournal Online is available to the public via the SEJournal Online main page. Subscribe to the e-newsletter here. And see past issues of the SEJournal archived here.
SEJ Publication Types:
Topics on the Beat:
Region:
Visibility:

